

S&P 500 Sector Correlations: A Smarter Fear Gauge Than the VIX?
For decades, investors have relied on the CBOE Volatility Index — better known as the VIX — to measure market fear. But while the VIX captures expected volatility through options pricing, another market-based signal may offer an even clearer window into investor psychology: sector correlations within the S&P 500.
When nearly every sector begins moving in lockstep, markets are no longer trading on fundamentals. They are trading on fear, macro uncertainty, liquidity stress, or broad investor confidence. Conversely, when sector behavior diverges, investors are discriminating between winners and losers — a hallmark of healthy risk appetite and stable market conditions.
The recent collapse in S&P 500 sector correlations to historically low levels suggests investors have become exceptionally confident again. History shows that such optimism often carries important implications for future equity returns.
Understanding Sector Correlations
Correlation measures how closely two assets move together.
- +1.0 correlation = perfect positive relationship
- 0 correlation = no relationship
- -1.0 correlation = perfect negative relationship
In equity markets, S&P 500 sectors generally maintain positive correlations because all stocks remain tied to the same underlying macro system: economic growth, interest rates, liquidity conditions, and investor confidence.
However, the degree of correlation changes dramatically across market cycles.
High Correlation Environment
When fear dominates:
- Investors sell indiscriminately
- Risk reduction becomes broad-based
- Sector differentiation disappears
- Correlations surge higher
Low Correlation Environment
When confidence is elevated:
- Investors actively rotate capital
- Stock selection matters more
- Sectors trade on individual fundamentals
- Correlations decline
This makes sector correlation analysis a highly effective behavioral indicator.
The Correlation Index
The current analysis uses trailing 30-day correlations between the S&P 500 and five major sectors:
- Technology
- Industrials
- Consumer Discretionary
- Financials
- Health Care
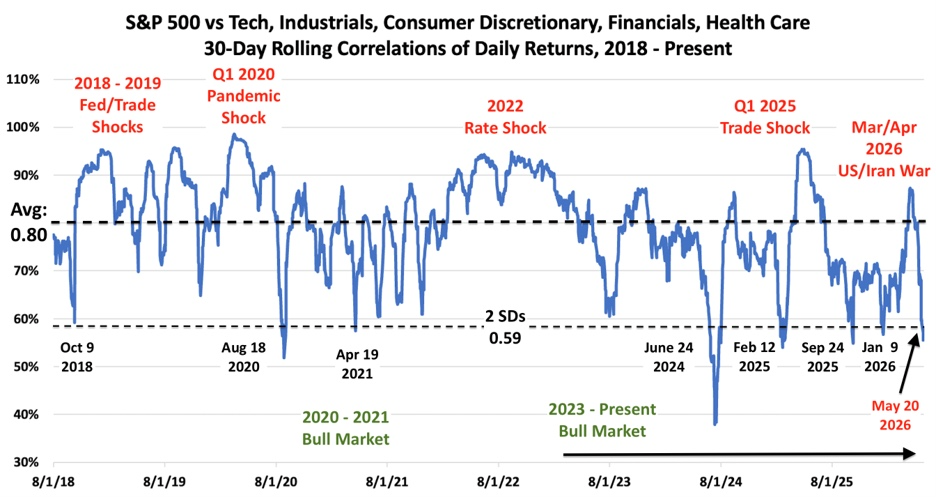
The long-run average correlation since 2018 stands near 0.80.
The latest reading has collapsed to approximately 0.56 — more than two standard deviations below the historical mean. That is statistically significant and historically rare.
The chart highlights how correlation behavior closely tracked every major macro regime since 2018:
2018–2019: Fed Tightening & Trade War
Correlations surged as investors worried about aggressive Federal Reserve tightening and escalating U.S.-China trade tensions.
Q1 2020: Pandemic Shock
Sector correlations exploded toward 1.0 as COVID-19 triggered indiscriminate liquidation across global markets.
2020–2021 Bull Market
Correlations collapsed as liquidity injections, stimulus, and reopening optimism drove aggressive risk-taking and sector rotation.
2022 Rate Shock
The Federal Reserve’s fastest tightening cycle in decades pushed correlations sharply higher again as investors de-risked.
2023–Present Bull Market
AI enthusiasm, resilient earnings, and improving macro conditions drove correlations back below average.
The latest drop below 0.60 on May 20, 2026, represents one of only eight such occurrences since 2018.
Why This Matters
Extreme readings in market indicators rarely persist indefinitely.
Historically, exceptionally low sector correlations tend to occur during periods of:
- strong momentum,
- concentrated optimism,
- expanding risk appetite,
- and heavy participation in growth sectors — especially Technology and Semiconductors.
But they can also signal excessive complacency.
That creates an important tension in the current market backdrop.
Statistical Backtest: What Happens After Correlations Collapse?
The second chart examines forward S&P 500 returns following previous instances where sector correlations fell more than two standard deviations below average.
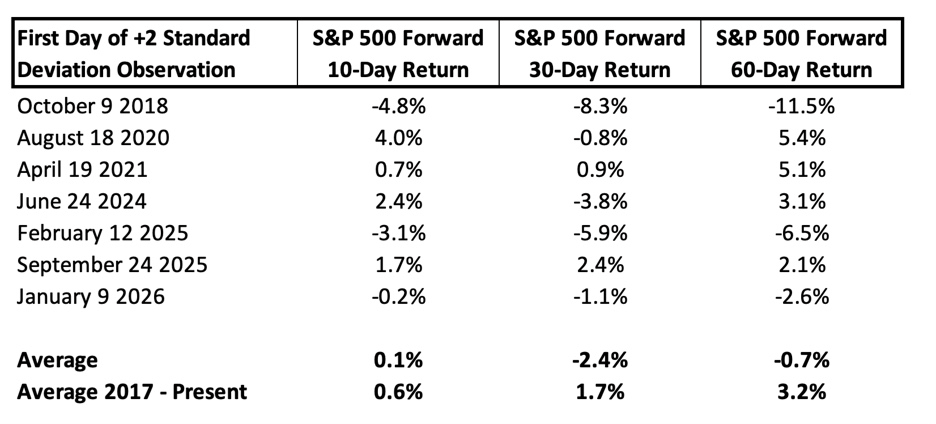
Forward Return Results
| Holding Period | Average Return After Extreme Low Correlations | Historical Average |
|---|---|---|
| 10 Trading Days | +0.1% | +0.6% |
| 30 Trading Days | -2.4% | +1.7% |
| 60 Trading Days | -0.7% | +3.2% |
The results are revealing.
Short-Term Momentum Can Continue
Several instances still produced strong gains immediately after extreme optimism:
- August 2020: +4.0% over 10 days
- June 2024: +2.4%
- September 2025: +2.4% over 30 days
This shows markets can remain euphoric longer than expected during powerful bull cycles.
But Medium-Term Returns Deteriorate
The 30-day forward data is considerably weaker:
- Average return: -2.4%
- Positive outcomes: only 2 of 7 observations
- Win rate: roughly 29%
That suggests markets often become vulnerable after investor confidence reaches extreme levels.
The data does not imply an imminent bear market. Rather, it suggests:
- upside momentum becomes harder to sustain,
- valuations become increasingly sensitive,
- and markets become more vulnerable to macro shocks.
Why 60-Day Returns Are Mixed
The weaker 60-day average was heavily distorted by several major macro disruptions:
- 2018 Fed policy tightening error
- Q1 2025 trade policy volatility
- Q1 2026 U.S.-Iran oil shock
Outside these periods, equity markets often stabilized and recovered after the initial correction phase.
That suggests excessively low correlations may reflect overheating rather than structural market deterioration.
The Current Signal: Bullish or Bearish?
The answer is: both.
Bullish Interpretation
The S&P 500 has already rallied approximately +2.2% since correlations breached the two-standard-deviation threshold seven trading days ago.
That performance resembles:
- August 2020
- September 2025
Both occurred during exceptionally strong bull markets fueled by powerful momentum and technology leadership.
Additionally:
- semiconductor stocks remain strong,
- AI capital expenditure remains elevated,
- earnings revisions for mega-cap tech are still supportive,
- and market breadth has improved modestly.
From this perspective, low correlations reflect healthy confidence and aggressive capital deployment into growth themes.
Bearish Interpretation
The statistical evidence becomes less supportive over longer horizons.
The negative average 30-day returns indicate:
- optimism may already be heavily priced in,
- positioning could be crowded,
- and markets may be vulnerable to profit-taking or macro disappointments.
Importantly, the current +2.2% gain already approaches the strongest historical 30-day outcome in the dataset.
That limits historical upside asymmetry from current levels.
The Real Driver: Technology and Semiconductors
The next phase for the S&P 500 will likely depend overwhelmingly on Technology — particularly semiconductors.
Sector correlations today are telling a very specific story:
- investors remain highly confident in AI-driven growth,
- leadership remains concentrated,
- and capital continues flowing aggressively into innovation-sensitive sectors.
If semiconductor earnings remain strong and AI investment continues accelerating:
- correlations could stay suppressed,
- momentum could persist,
- and the market may continue grinding higher.
But if Technology leadership weakens:
- correlations could quickly normalize,
- risk appetite could fade,
- and broader equity volatility may return rapidly.
Final Takeaway
Sector correlation analysis offers a powerful alternative to traditional fear gauges because it directly measures investor behavior beneath the market surface.
The current environment reflects:
- exceptionally strong confidence,
- highly selective capital allocation,
- and sustained enthusiasm around growth leadership.
But history also warns that when confidence becomes statistically extreme, future returns often become less attractive over the next one to two months.
For investors, the message is nuanced:
- the trend remains constructive,
- momentum remains alive,
- but risk management becomes increasingly important as optimism reaches historically elevated levels.
In the coming weeks, the most important signals to monitor will likely be:
- semiconductor earnings,
- AI capital spending,
- Treasury yields,
- and whether sector correlations begin reverting higher again.
Because when correlations rise sharply, markets usually stop trading on opportunity — and start trading on fear.